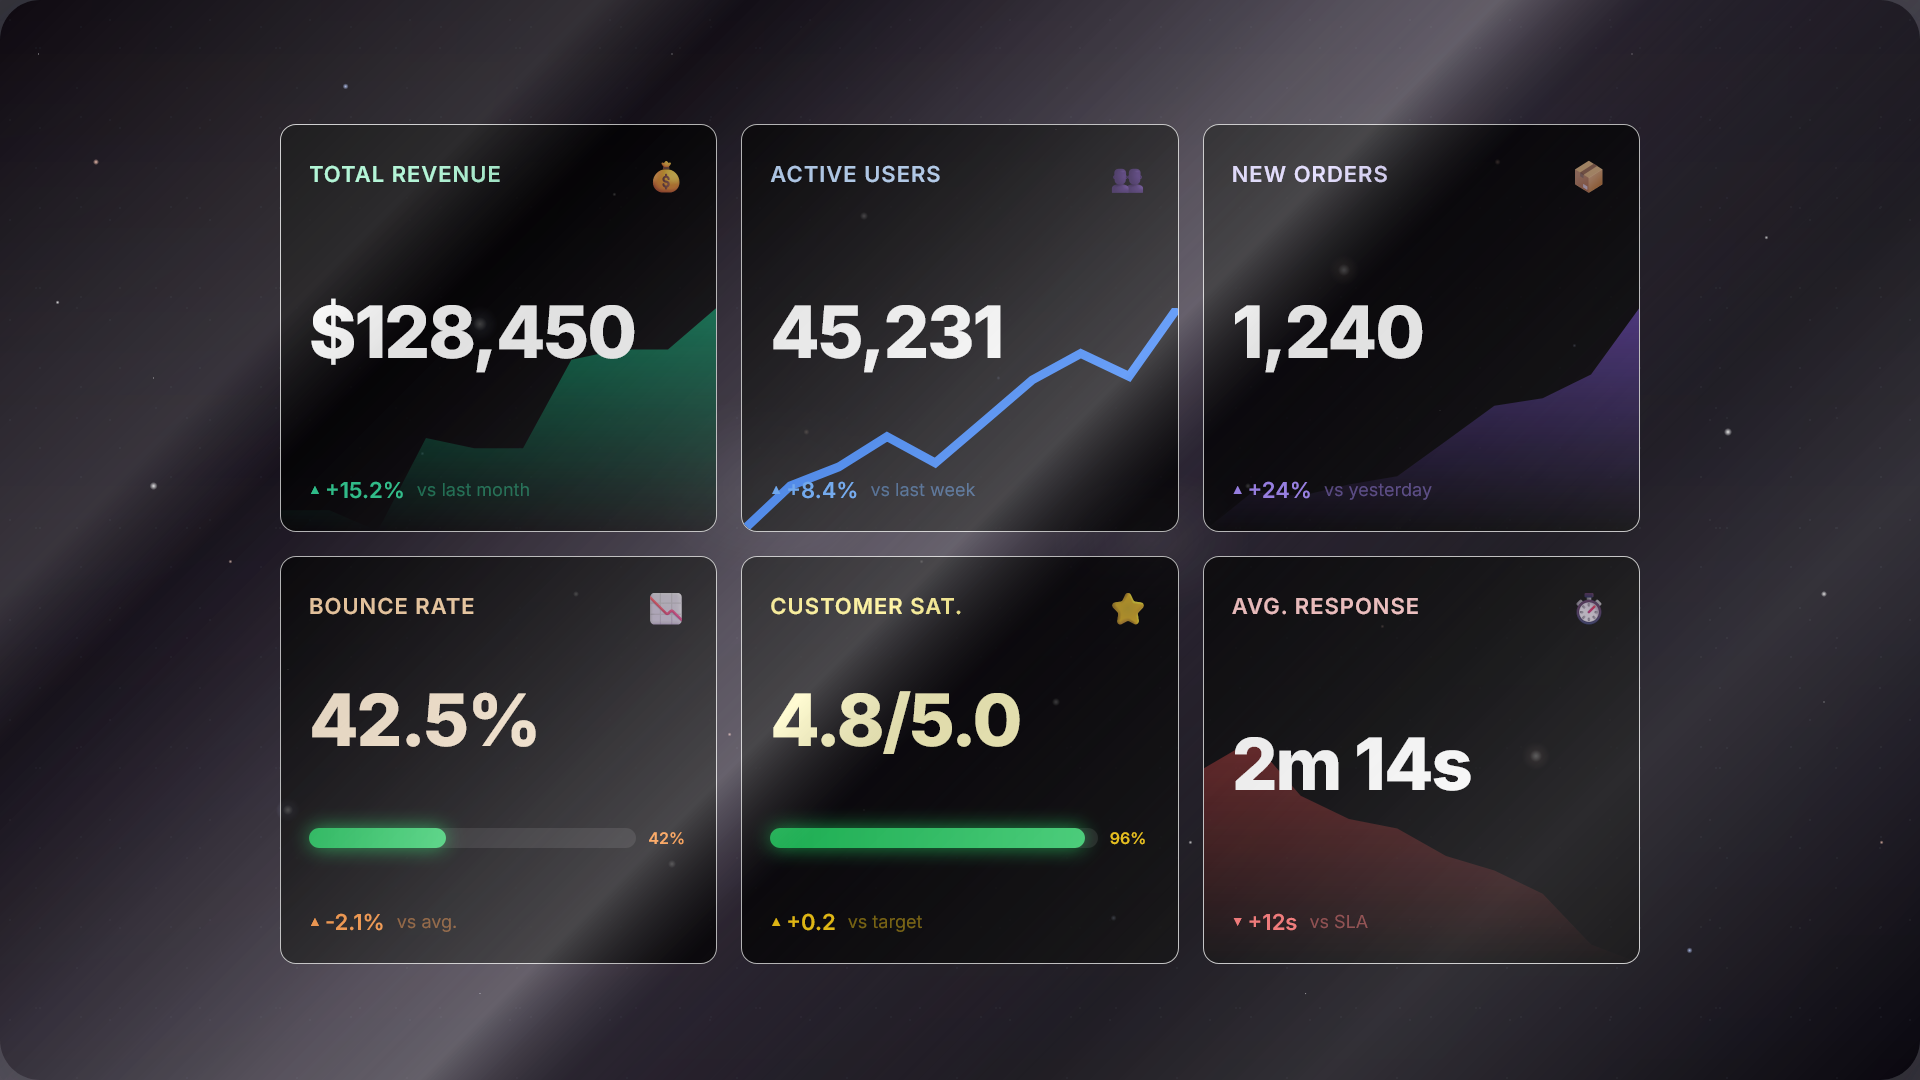
KPI Cards
Transform your key performance indicators into stunning visual cards. Display revenue, users, conversions, and any metric that matters — with sparklines, trends, and progress bars that tell the story at a glance.
What are KPI Cards?
KPI Cards are compact, information-dense visual elements designed to communicate key business metrics instantly. Unlike traditional charts that show detailed data over time, KPI Cards focus on what matters right now — the current value, how it's trending, and whether you're on track.
Each card typically displays a metric title, the current value (like "$1.2M" or "45,231 users"), a change indicator ("+12.5%"), and an optional visual element such as a sparkline or progress bar.
Why use KPI Cards?
- Instant clarity — See your most important numbers at a glance
- Space efficient — Display 4-8 metrics in the space of one chart
- Executive-friendly — Perfect for stakeholder dashboards
- Trend awareness — Sparklines show direction without clutter
- Customizable — Match your brand with colors, icons, and styles
When to use
- Executive dashboards and board reports
- Sales and marketing performance tracking
- Financial summaries (revenue, profit, costs)
- User analytics (sign-ups, active users, churn)
- Operations monitoring (uptime, response time)
- Goal tracking with progress indicators
Key Features
- Ambient Sparklines — Beautiful background sparklines that show trends without overwhelming the main value
- Progress Bars — Visualize goal completion with animated progress indicators
- Trend Indicators — Automatic positive/negative/neutral styling with customizable colors
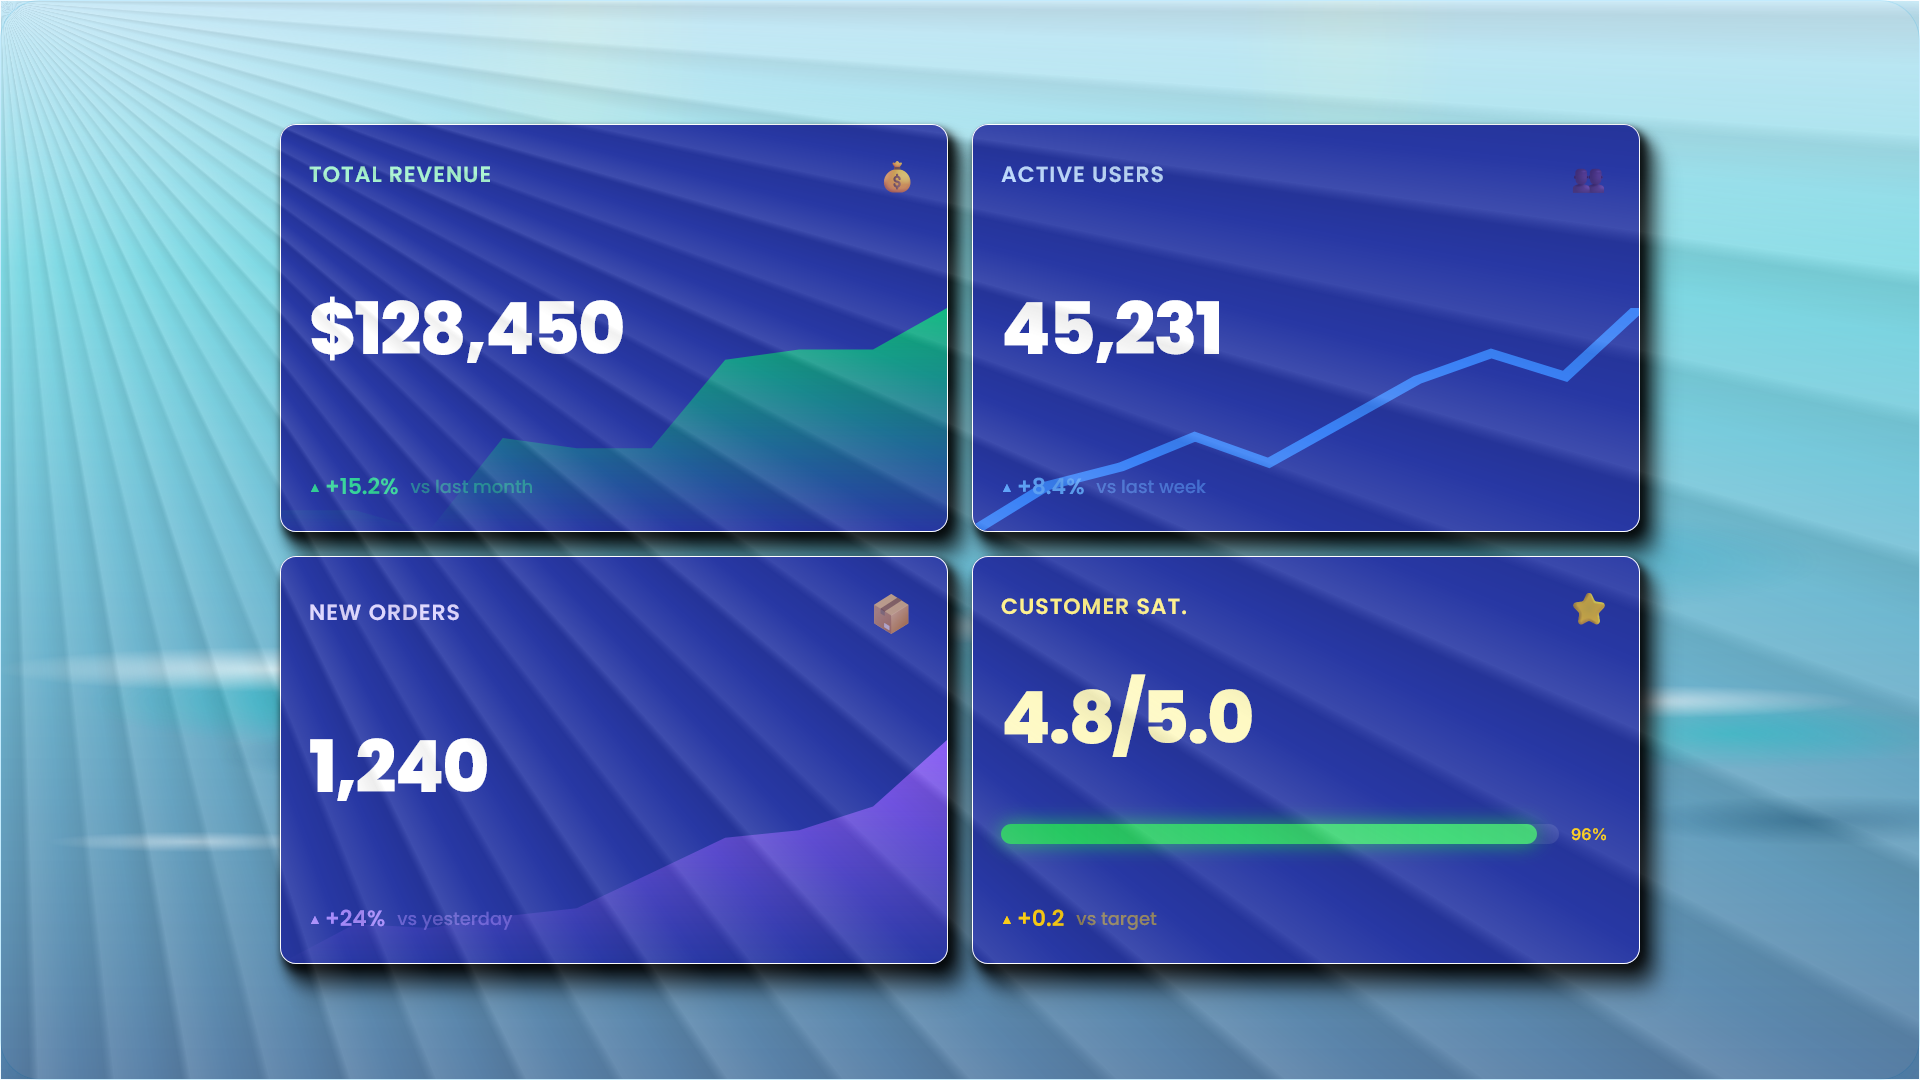
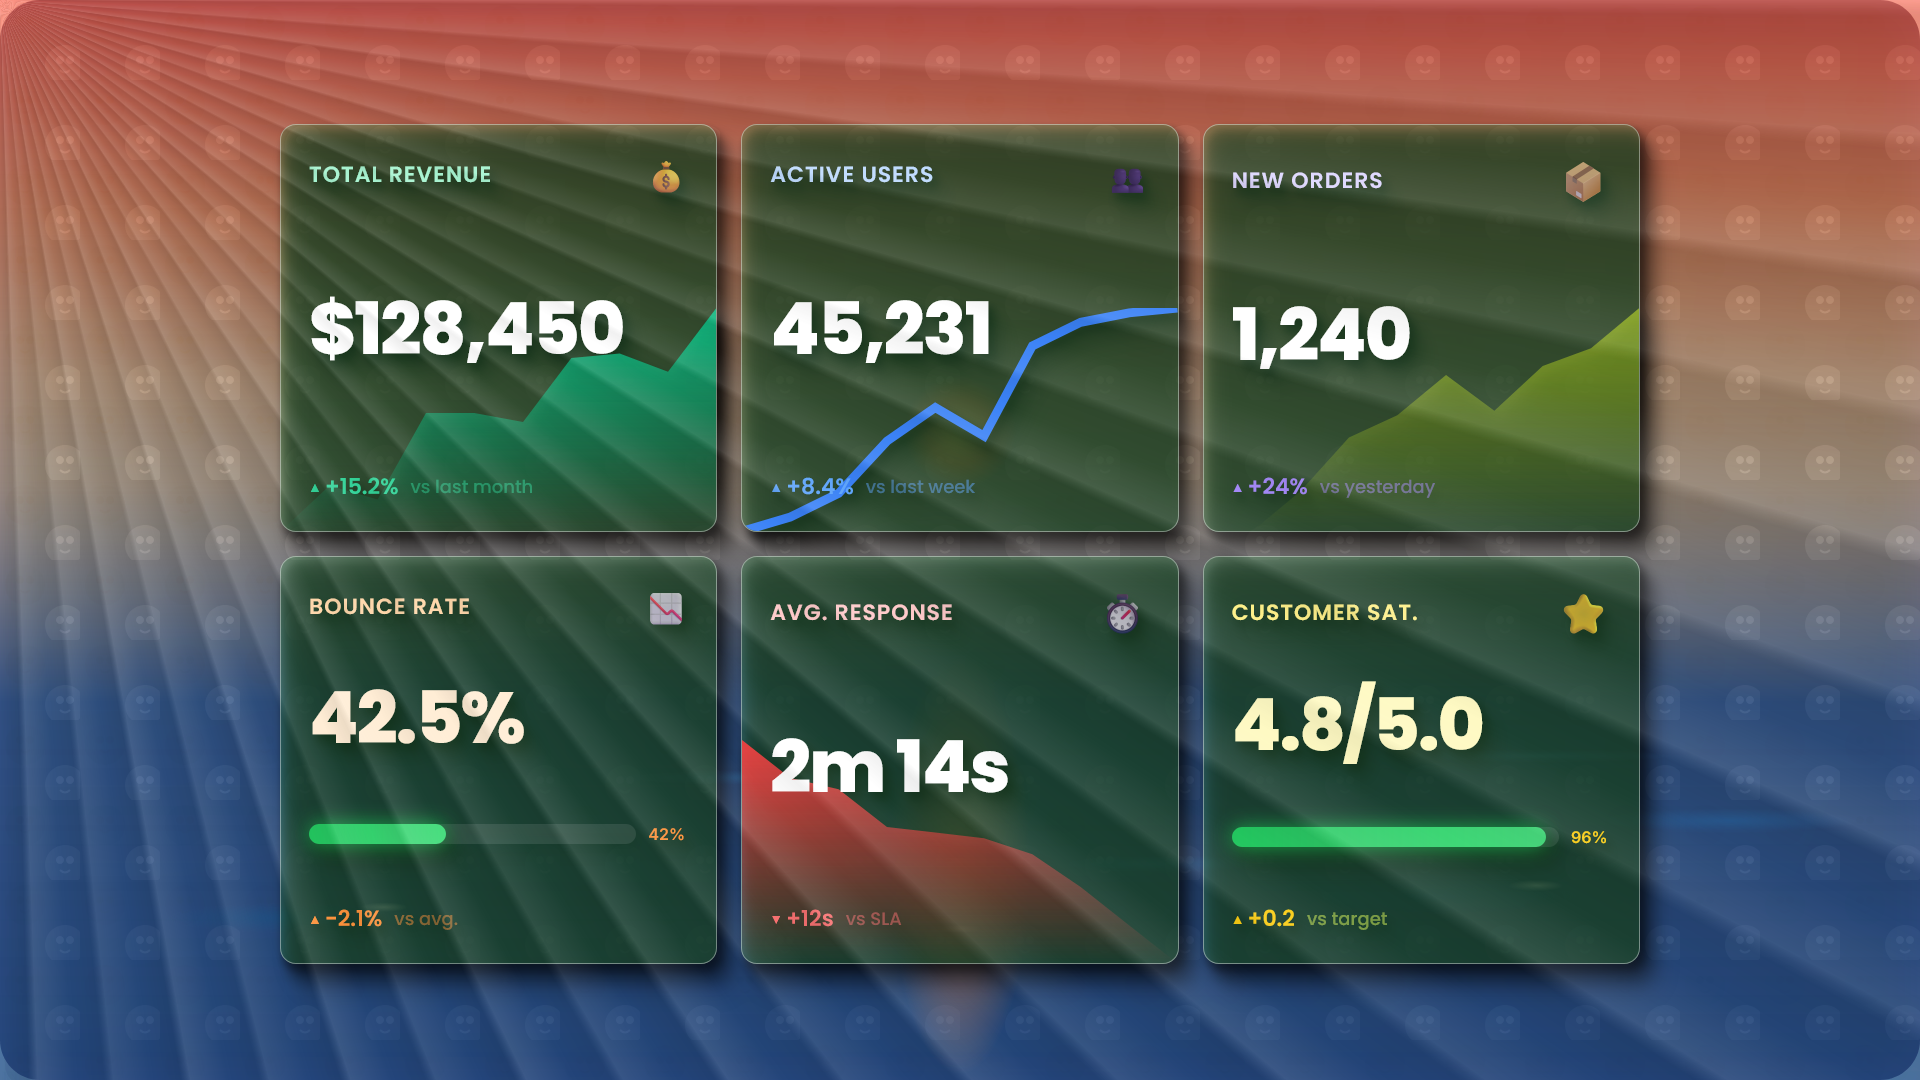
- Custom Styling — Per-card colors, icons, and typography to match your brand
- Drag & Drop — Reorder cards intuitively to prioritize what matters most
- Responsive Layout — Cards automatically adapt from 1 to 4 columns based on screen size
FAQ
What are KPI Cards?
KPI (Key Performance Indicator) Cards are compact visual elements that display important business metrics at a glance. They typically show a metric name, current value, trend indicator, and optional visualizations like sparklines or progress bars.
When should I use KPI Cards instead of charts?
Use KPI Cards when you need to display multiple key metrics in a dashboard format, when the exact current value is more important than detailed trends, or when you want to provide a quick executive summary of performance.
Can I customize the appearance of KPI Cards?
Yes! PrettyChart KPI Cards support custom colors, icons, sparkline styles (area or line), progress bars, and typography settings. You can match them to your brand or dashboard theme.
How many KPI Cards can I create?
You can create up to 6 KPI Cards per dashboard. This limit ensures optimal readability and prevents information overload. Each card can be fully customized independently.
Can I export KPI Cards as images?
Absolutely! KPI Cards can be exported as PNG, SVG, or PDF just like any other chart type in PrettyChart. Perfect for presentations, reports, and sharing.
Ready to Build Your KPI Dashboard?
Create stunning metric cards in seconds. No signup required.